Events Viewer
Open a run from MesoSim Backtests, then select Events. The event log records the strategy's execution, including entries, adjustments, exits, variable updates, and end-of-day events. Use it to understand why a trade occurred and what values were recorded at that point.
Navigate events
On desktop, the table shows Sim Time, Event Type, Message, and available account and position information. Pos Id identifies the position associated with an event; account-level events may have no position ID.
- Use column filters to narrow the view by position, event type, time, or message. Text filters are case-insensitive.
- Select a column heading to sort the events. Use Sim Time to follow the historical simulation timeline.
- Use the paging controls to move through the results. The page-size selector offers 10, 20, 50, or 100 events.
- Click inside the table, then use ← and → to move to the previous or next page.
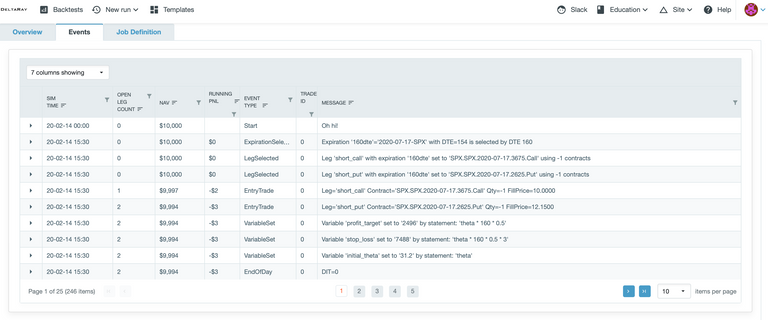
Table layout
Use the column picker to show or hide fields, and drag column borders to resize them. The table saves its settings in your browser. Select Reset layout to restore the default table view when filters or layout changes make events difficult to find.
Inspect variables
Expand a row using the triangle in its leftmost column to see the variables stored with that event. The details group general variables under Generic and leg-specific variables under each leg's name.
For example, inspect pos_delta alongside a leg's delta, quantity, or strike to understand the position at that timestamp. Refer to the Script Engine and Strategy Definition Reference for variable meanings and where expressions can be used.
Some events do not include a variable snapshot. No variables stored means no values were recorded with that event; it does not mean the variables were zero.
The variable table displays values to two decimal places. Keep this rounding in mind when comparing displayed values with a condition's threshold.
Trace a strategy decision
- Identify the position and time of interest in Position Monitor.
- In Events, filter by Pos Id and review the surrounding events in simulation-time order.
- Read the event messages, then expand the relevant rows to inspect the recorded variables. Compare them with the conditions in the run's Strategy Definition.
- If you want to test a change, clone the backtest, change one thing, and compare the new event sequence with the original.
For a worked strategy example, see rebalancing delta with Adjustments. Deltaray's Advanced MesoSim Patterns also illustrates how custom variables can capture strategy state.
Further analysis
Export Events
Use Export Events from the action menu on the backtest results page to download the event log. You can post-process the exported data with Excel or Python for custom calculations, summaries, and charts. See Events export for its structure and event fields.
Analytics with DataVoyager
Open the Analytics tab on the backtest results page to explore the event data interactively with DataVoyager. Follow the Analytics with DataVoyager guide to plot captured entry variables against final position PnL, investigate relationships, and test potential trade filters.