Margin Report

Open a run from MesoSim Backtests, then select Margin Report to inspect the margin recorded during the simulation. Use the chart to see when requirements increased and how overlapping positions contributed to account margin.

Enable margin calculation

Choose a margin model in Settings.Core.Margin before running the backtest. This example enables Reg-T calculation with an explicit calculation mode and house multiplier:

"Settings": {
"Core": {
"Margin": {
"Model": "RegT",
"HouseMultiplier": 1.0,
"RegTMode": "CBOEPermissive"
}
}
}

This is a fragment to merge into your existing Strategy Definition; retain its other settings.

  • RegT calculates margin using the supported Reg-T rules. RegTMode selects CBOEVanilla or CBOEPermissive.
  • PMLike estimates margin by evaluating the position's Risk Graph over the lower and upper price bounds in PMConfig.
  • None disables margin calculation.

HouseMultiplier scales the model's calculated requirement. For all fields and examples, see Margin settings. See Accounts and Access for plan coverage.

Sampling

The report summarizes the available recorded samples. Keep Position Monitor trace collection at Daily, or use Hourly for finer intraday detail. When recorded traces are unavailable, the report can use captured end-of-day margin events.

A maximum in this report is the largest recorded value. Coarser sampling can miss a peak between observations.

If the tab says Margin not captured in run, clone the backtest, enable a margin model in the AI Editor, and run it again. Changing settings does not add margin data to an existing result.

Interpreting results

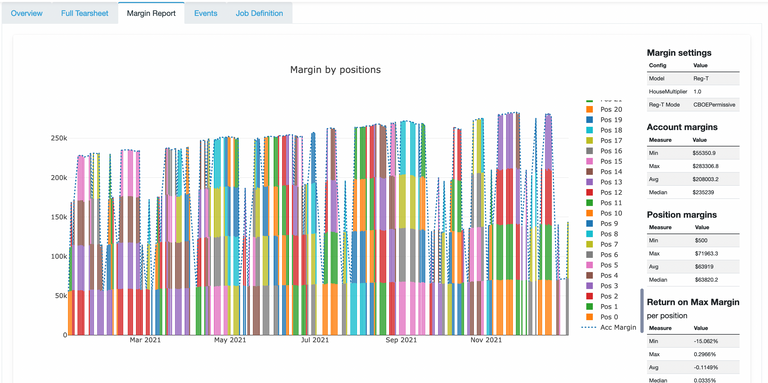
Margin Report with stacked position-margin bars, an account-margin line, model settings, and summary statistics.
Margin history and summary statistics. Select the image to view it at full size.
  • Position bars show the margin attributed to each position at a recorded timestamp. They are stacked to make overlapping requirements visible.
  • Acc Margin is the account-margin line. In the recorded position data, it is the sum of position margins at that timestamp.
  • Margin settings shows the model and HouseMultiplier, plus the Reg-T mode or PM-like lower/upper bounds used for the run.

For a rise in margin, identify the contributing positions and inspect their Position Monitor and Events. The multiple positions guide explains how to configure overlapping trades.

Recorded RegT margin usage for GeneticRhino, alongside model settings and margin statistics.

Summary statistics

SummaryWhat its Min, Max, Avg, and Median describe
Account marginsThe account-margin samples over the recorded period
Position marginsAll recorded position-margin samples pooled across positions
Return on Max MarginOne return-on-margin ratio per position, summarized across positions

The Position margins table is a combined summary. Use the chart's individual position series to inspect a particular trade. Average and median describe the recorded samples, so changing trace frequency can change these statistics.

Return on Max Margin

For a completed position with a positive maximum recorded margin:

Formula

Return on Max Margin = Position PnL at exit ÷ Maximum recorded margin during that position

For example, a position that finishes with $500 PnL and reaches $5,000 maximum recorded margin has a ratio of 0.10, equivalent to 10%. The ratio is not annualized.

This measure relates the outcome of a trade to its peak recorded margin requirement. Use Quantitative Metrics for NAV-based return and risk measures, and Backtest Results to inspect the overall strategy outcome.

Compare margin assumptions

When comparing runs, keep the model, house multiplier, sampling frequency, and analysis dates consistent. For PM-like calculations, also compare the lower and upper price bounds.

The report reflects the configured simulation model. Broker house requirements and margin treatment can differ. Deltaray's Reg-T margin introduction explains the background, and its PM-like margin overview describes the projection-based approach.