Position Monitor
The Backtest Position Monitor can display 2D and 3D Risk Graphs, Profit and Loss (PnL), and Greeks for each position within a specific backtest. To offer a market perspective, it also shows the underlying and VIX prices throughout the duration of the position.
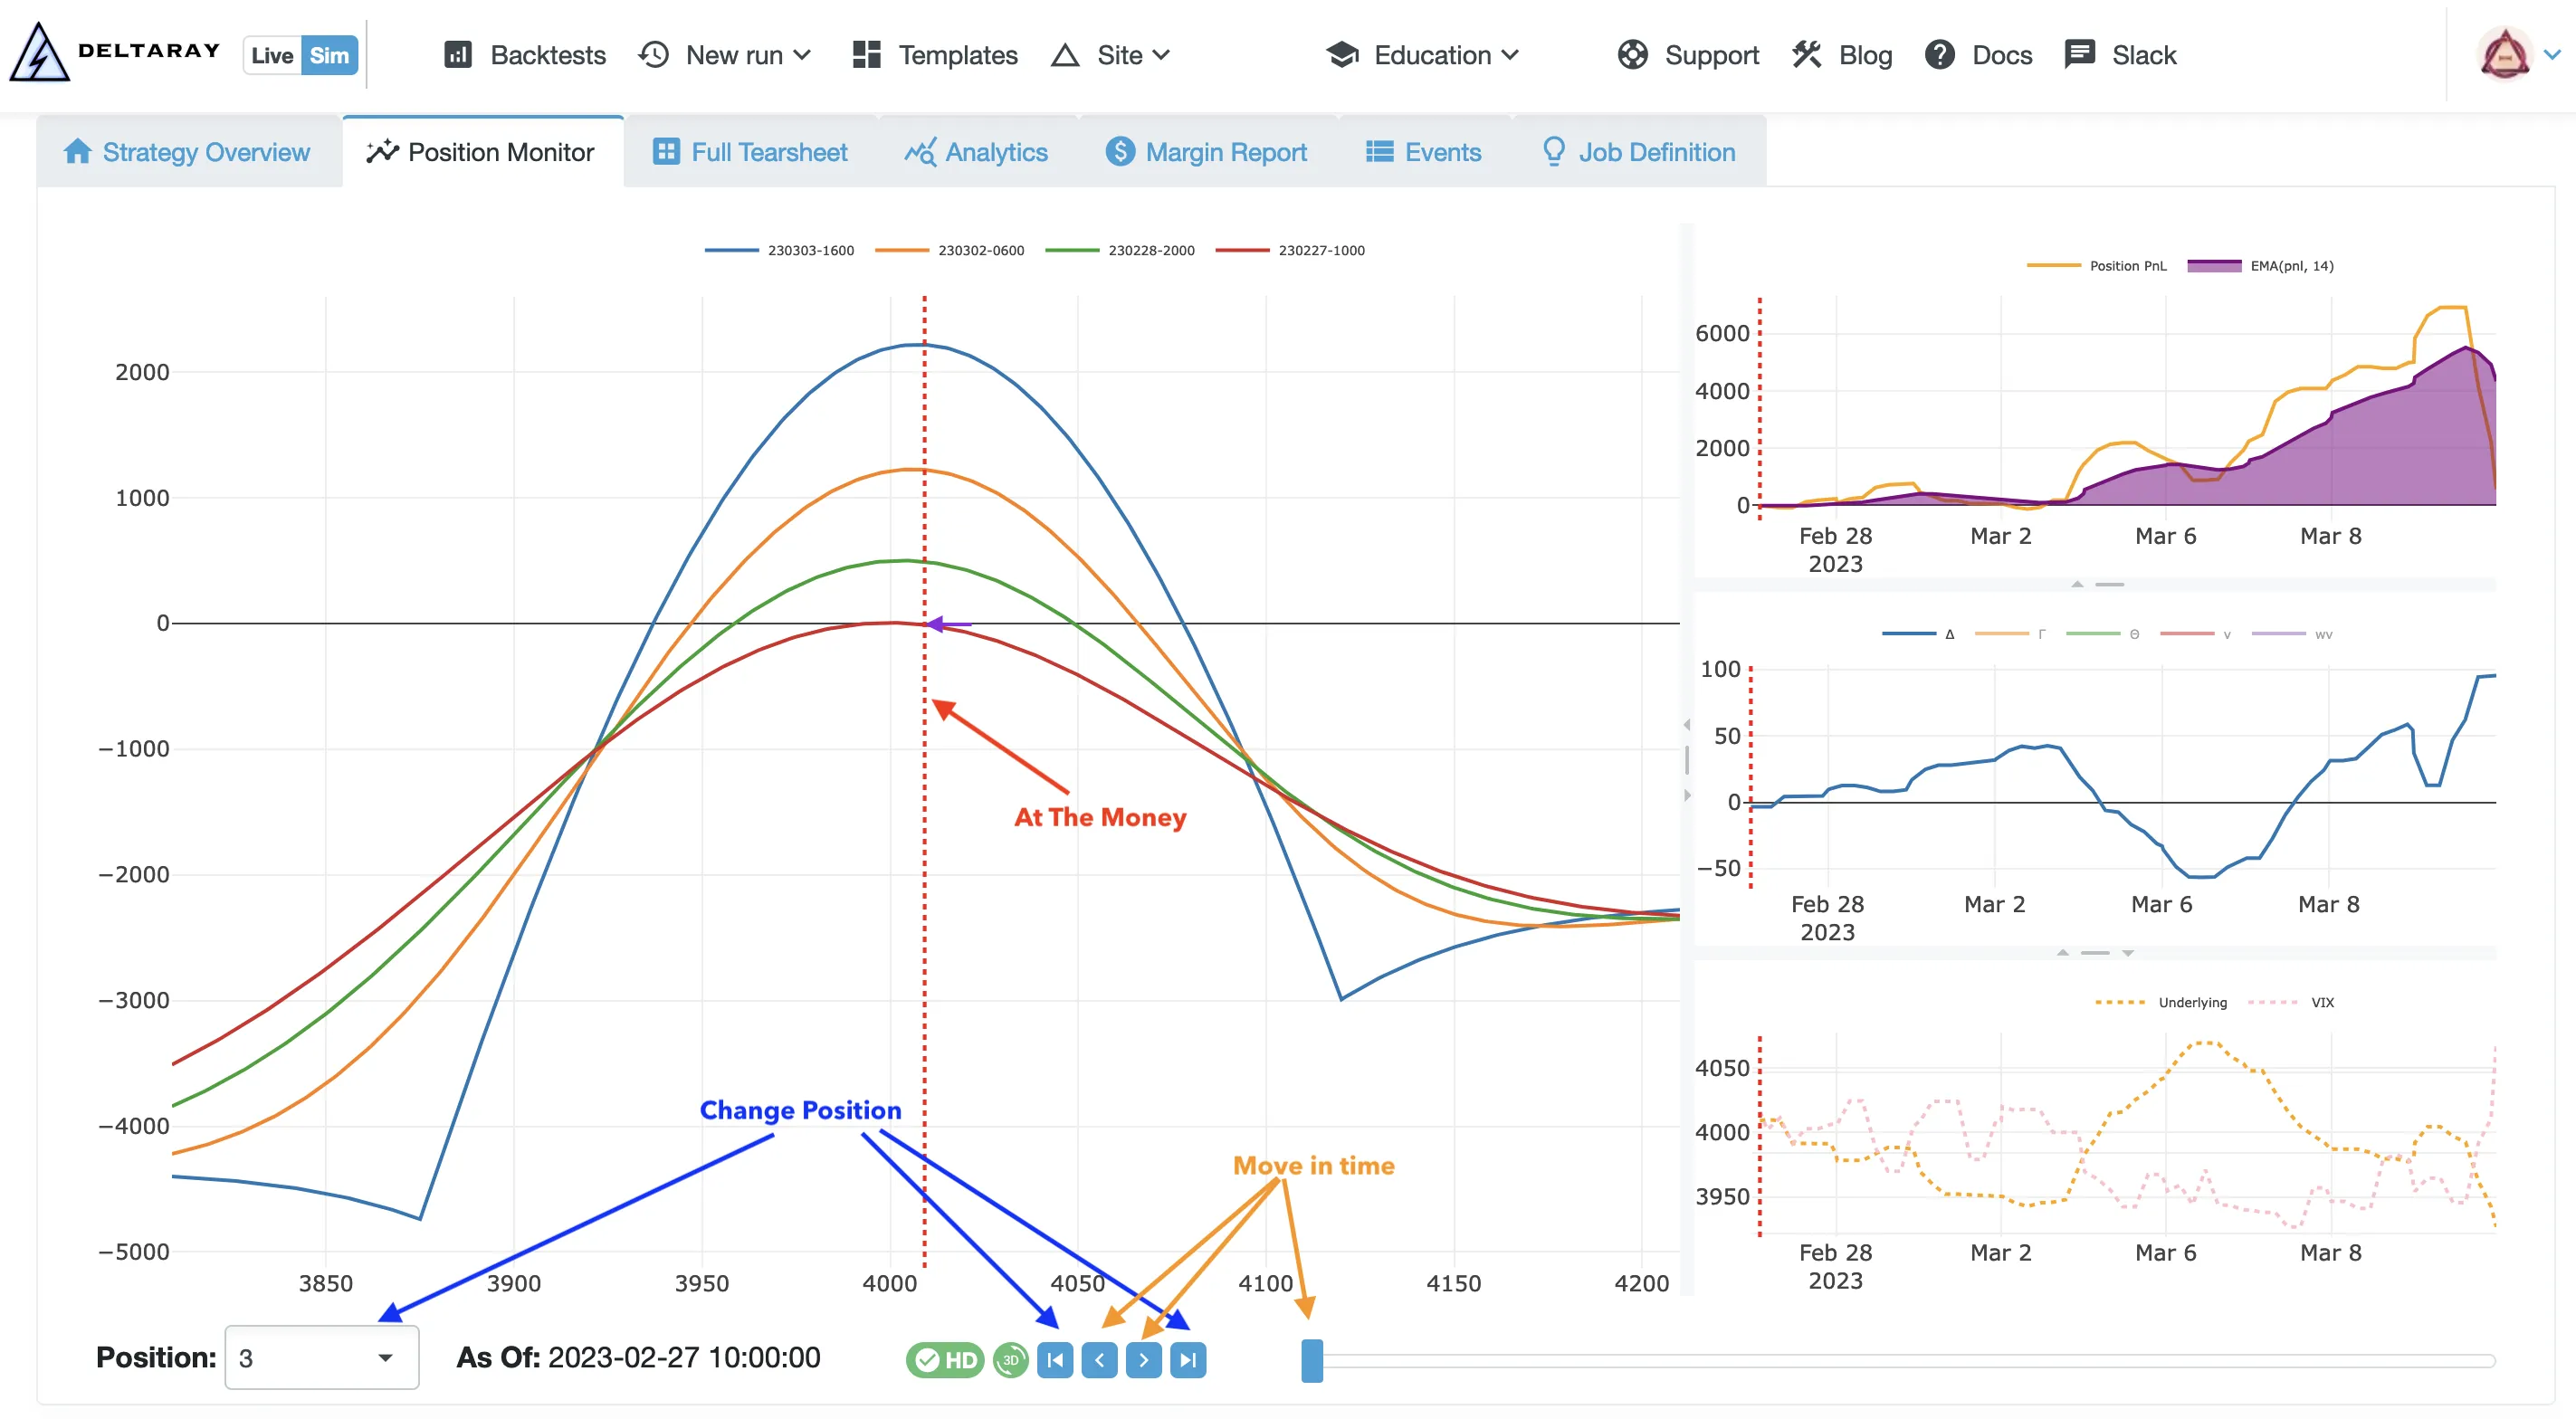
HD Mode
When enabled, the Risk Graphs adjust to address challenges specific to both short- and long-dated options. Please refer to the Accuracy section below for a complete understanding of this rendering mode.
Accuracy
The Risk Graph Projection utilizes BQL - our proprietary extension of QuantLib - to deliver unparalleled accuracy in modeling both short- and long-dated options. We employ the Black-Scholes-Merton (BSM) model and tackle critical yet frequently overlooked challenges: the impact of weekends and business holidays and the determination of the risk-free rate.
IV over Weekend
Have you ever tried to project the payout of short-dated options that span over a weekend? You might have noticed that the Risk Graph drastically changes from Friday to Monday in traditional modeling software. This is because the implied volatility (IV) on Friday accounts for the weekend, a time when markets are closed but market-moving events can still occur. With HD mode enabled, we adjust the IVs to provide a more accurate projection in MesoSim.
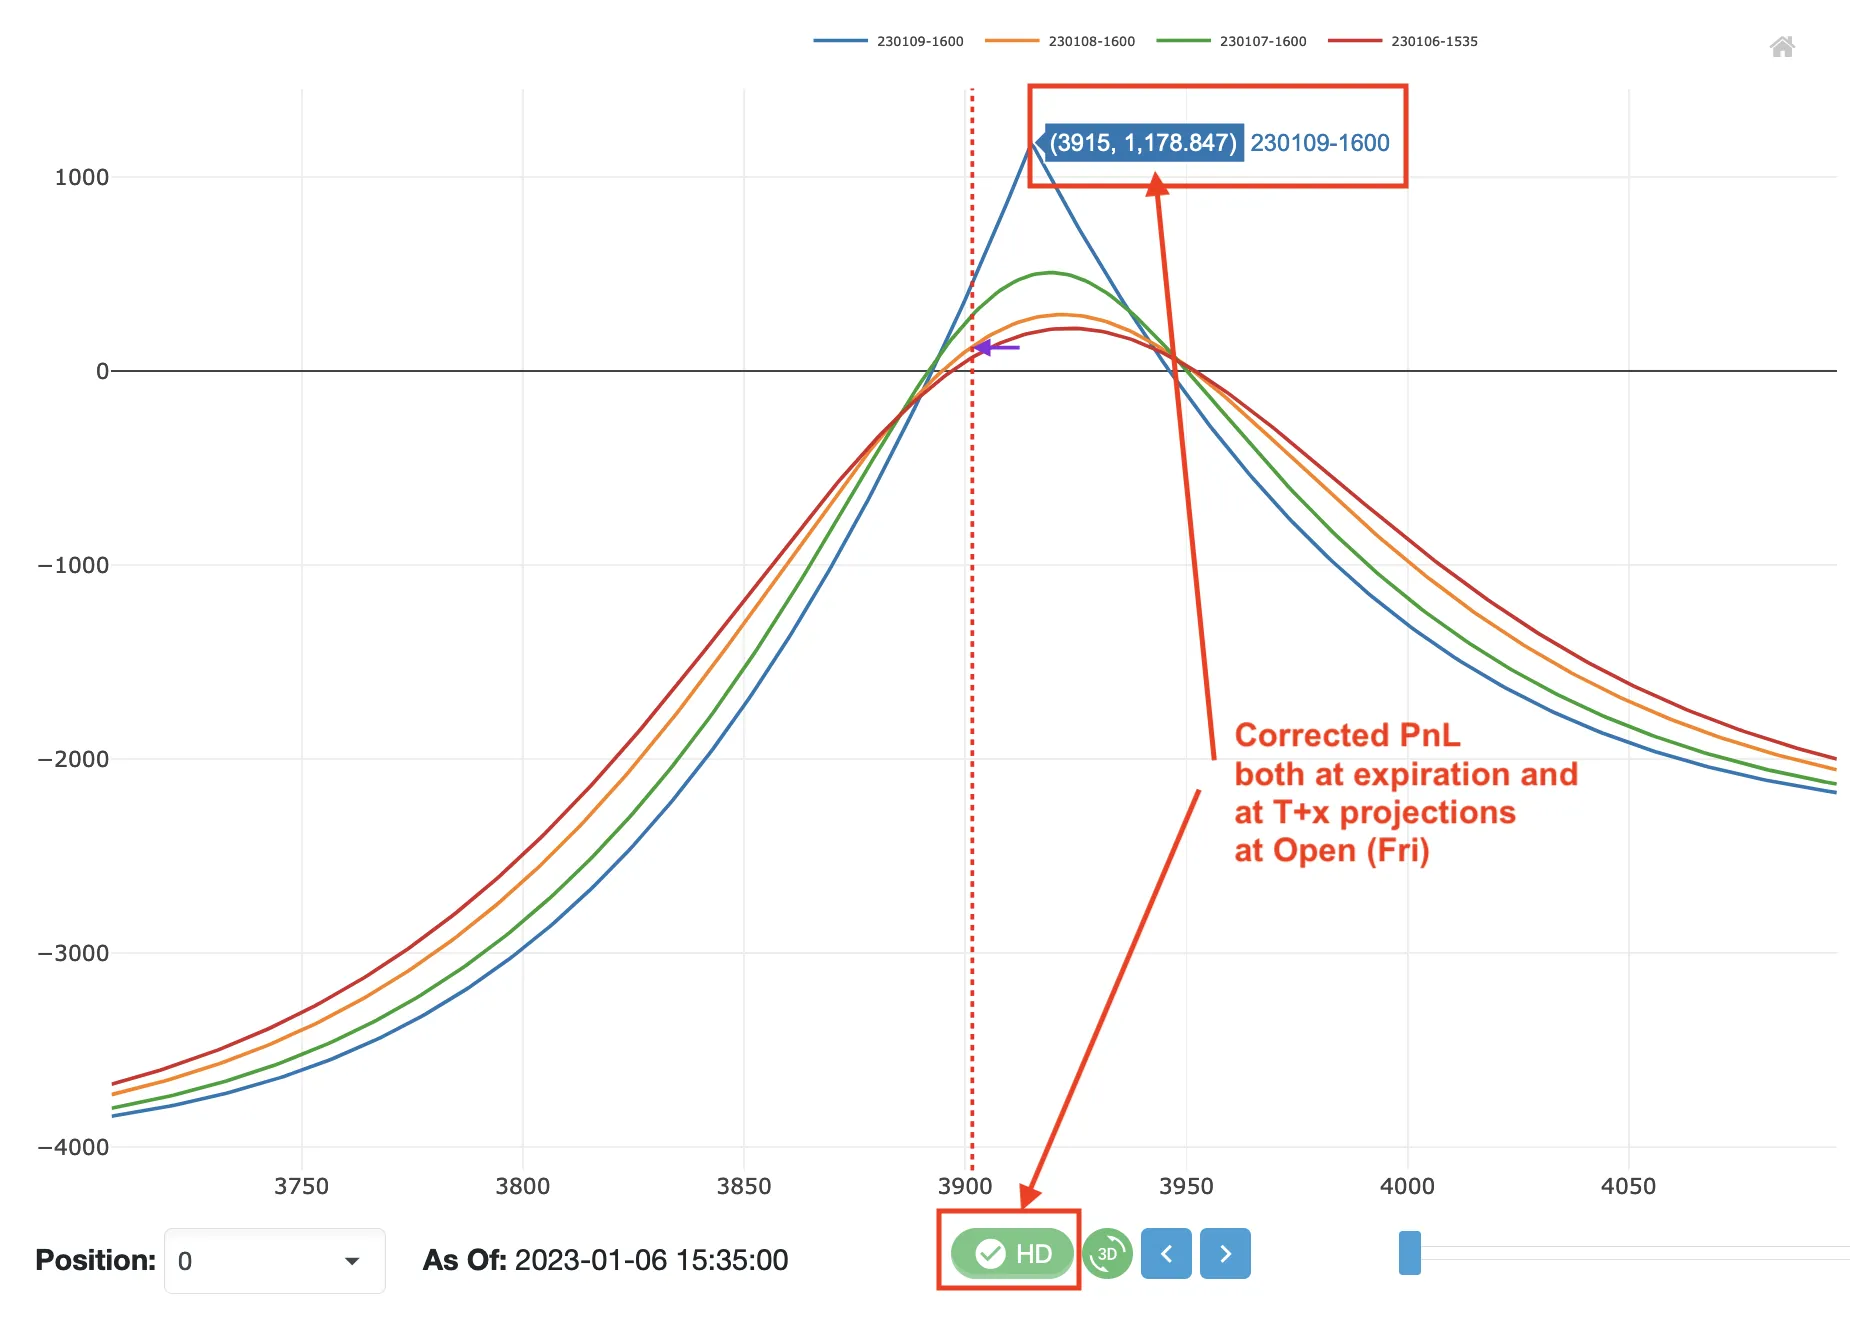
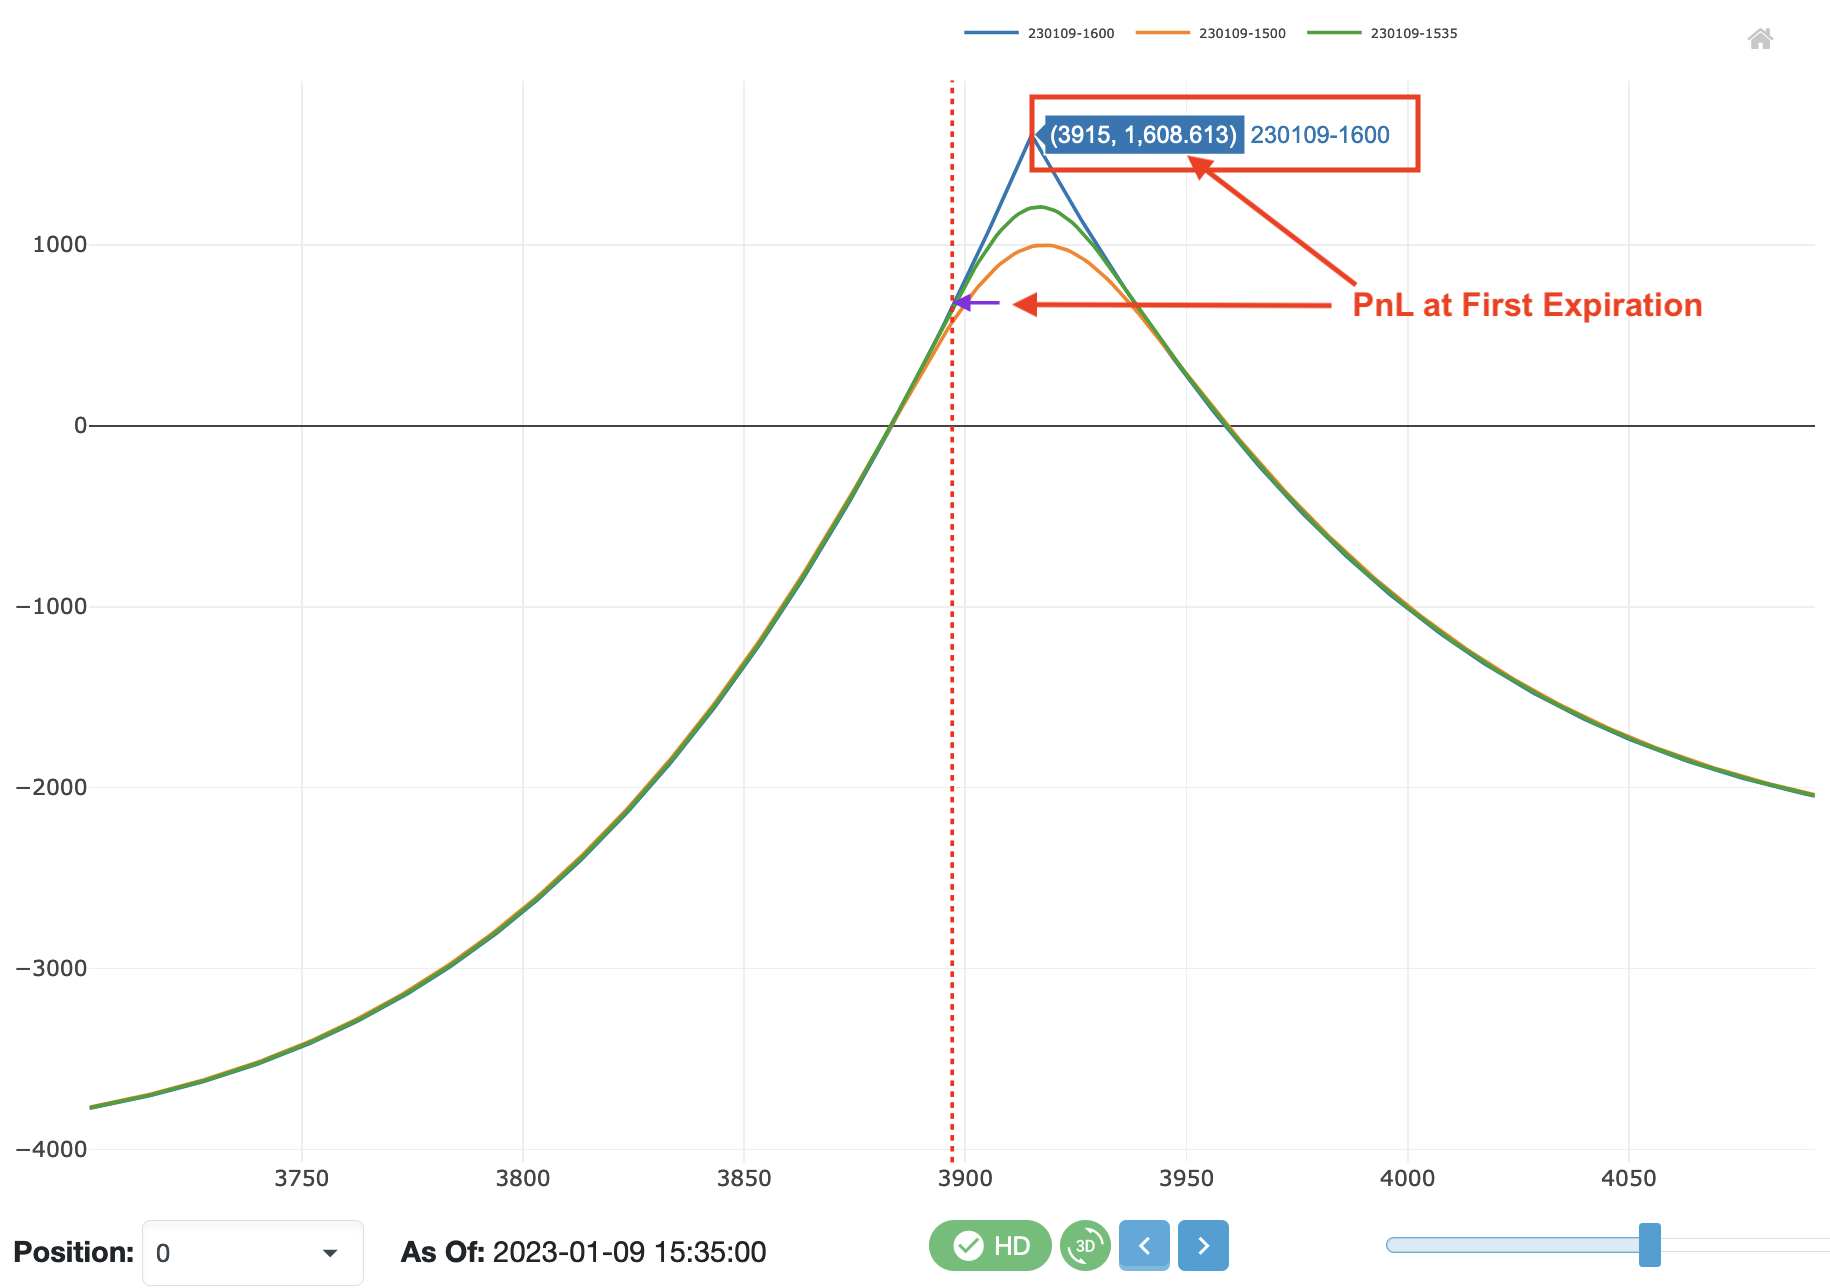
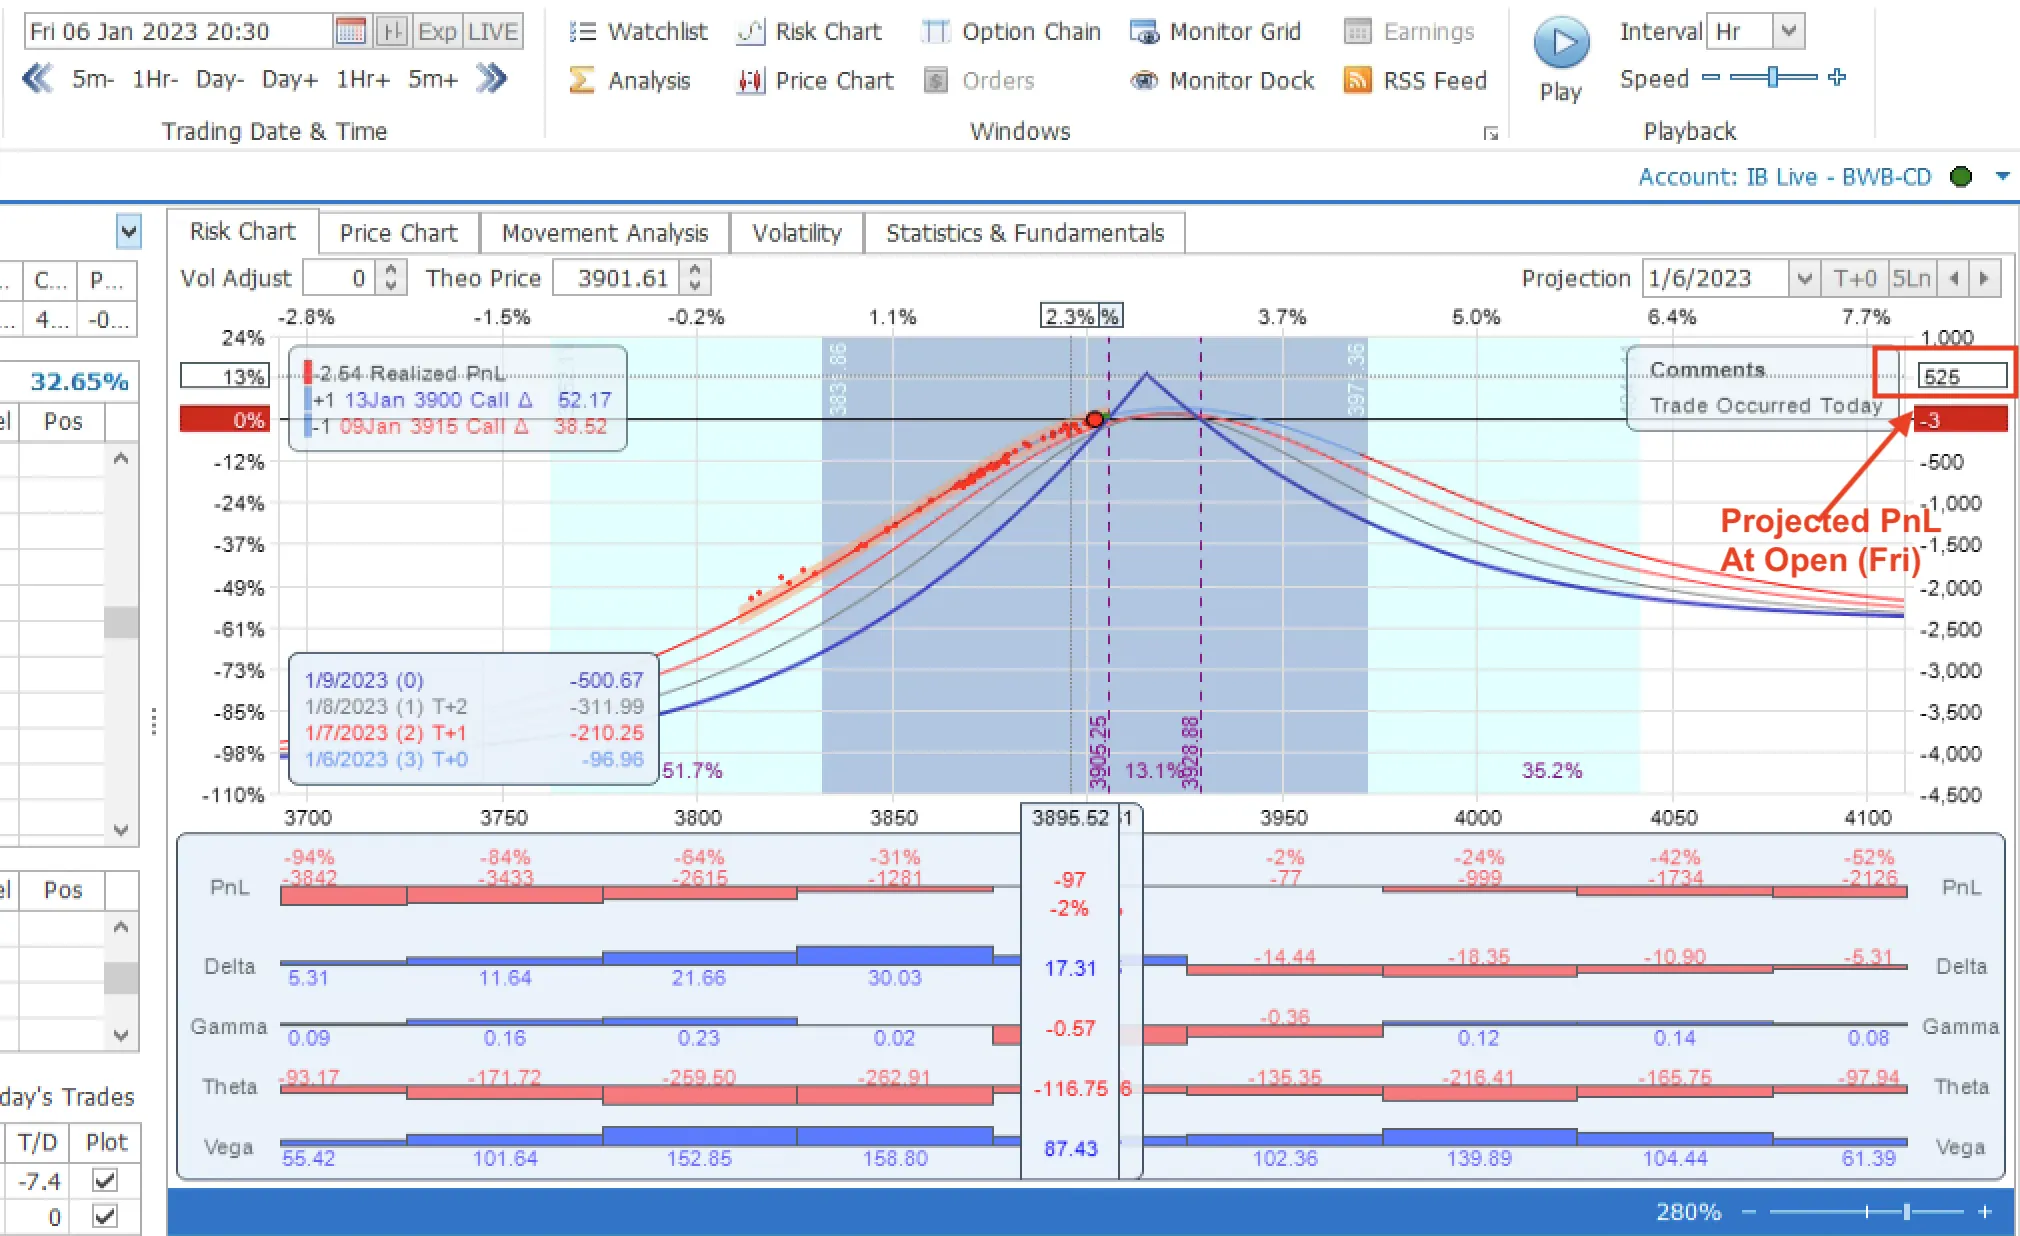
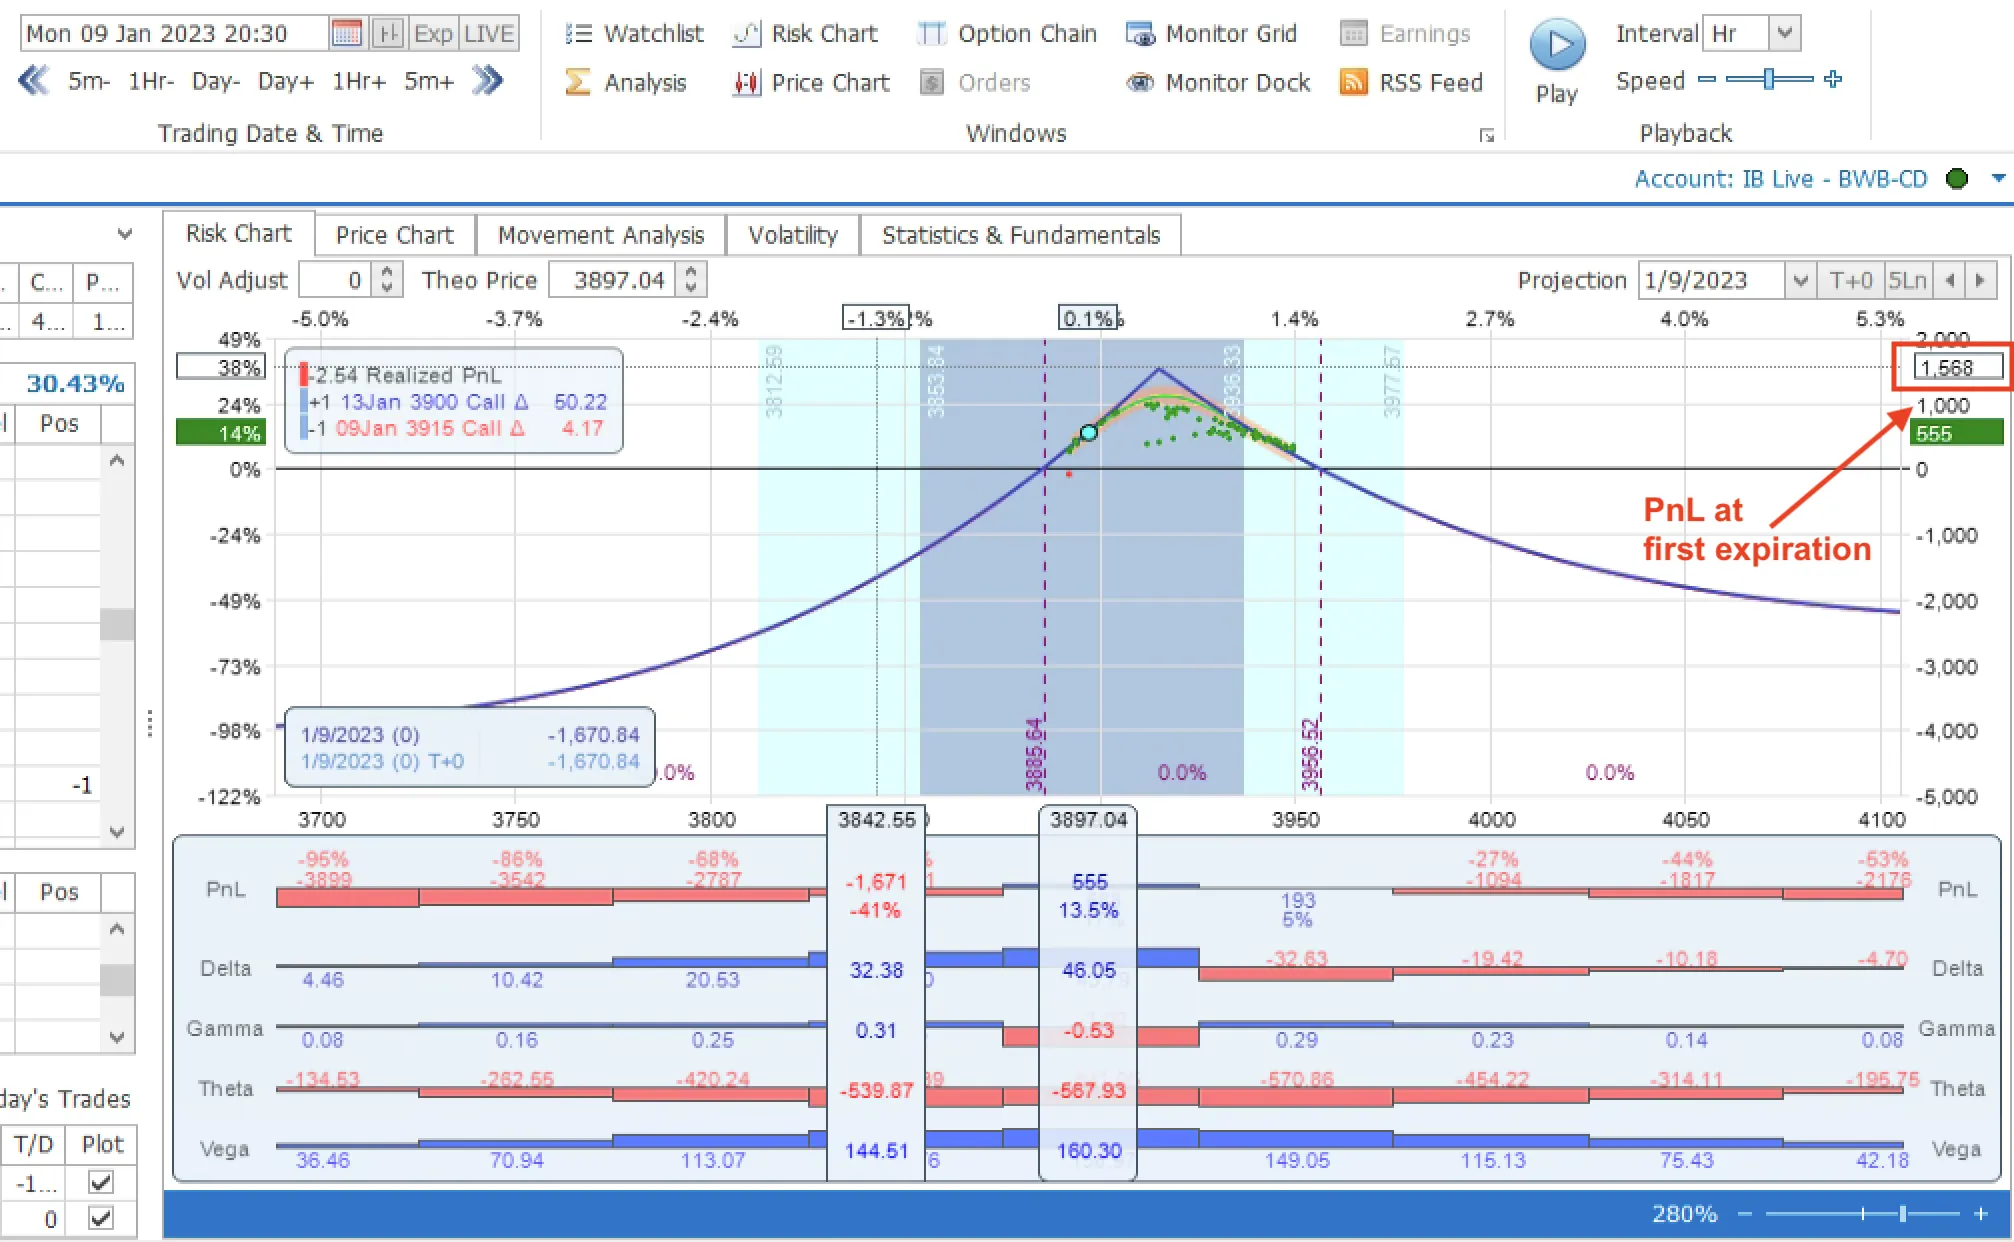
As the screenshots demonstrate, OptionNet Explorer (among others) tends to underestimate the payout for the outlined scenario. When HD mode is disabled, MesoSim’s Risk Graph resembles those of lower-resolution modeling tools.
Further read: This topic is covered by Harel Jacobson (volquant) and Kris Abdelmessih (Moontower).
Business days vs. Calendar days
The BSM Model requires the number of days until expiration to be provided. While most implementations utilize Calendar Days, it's important to note that US Index Options are tradable only on business days. To improve accuracy, we use a Business Calendar that accounts for weekends, market holidays, and early closures.
Risk-Free Rate
The risk-free rate is an essential input parameter for the BSM model. While US Treasury bills (T-Bills) are commonly used as a simple proxy for the risk-free rate, more accurate results can be achieved by extracting (bootstrapping) the risk-free rate from option chains. This extraction can be performed using Box Spreads, where we establish a synthetic long and a synthetic short position at the same set of strikes within the same expirations. For European options, the payout will reflect the actual risk-free rate as implied by the option contracts.
We calculate thousands of Box Spreads to derive a stable measure for each expiration. We then apply the expiration-specific risk-free rate to project the PnL for the position in question.
Accurately determining the risk-free rate is particularly crucial for longer-dated options and has become increasingly relevant as we move away from the zero interest rate policy (ZIRP).
Further read: Risk-Free Interest Rates by Jacobs Levy Equity Management Center
Time Projections
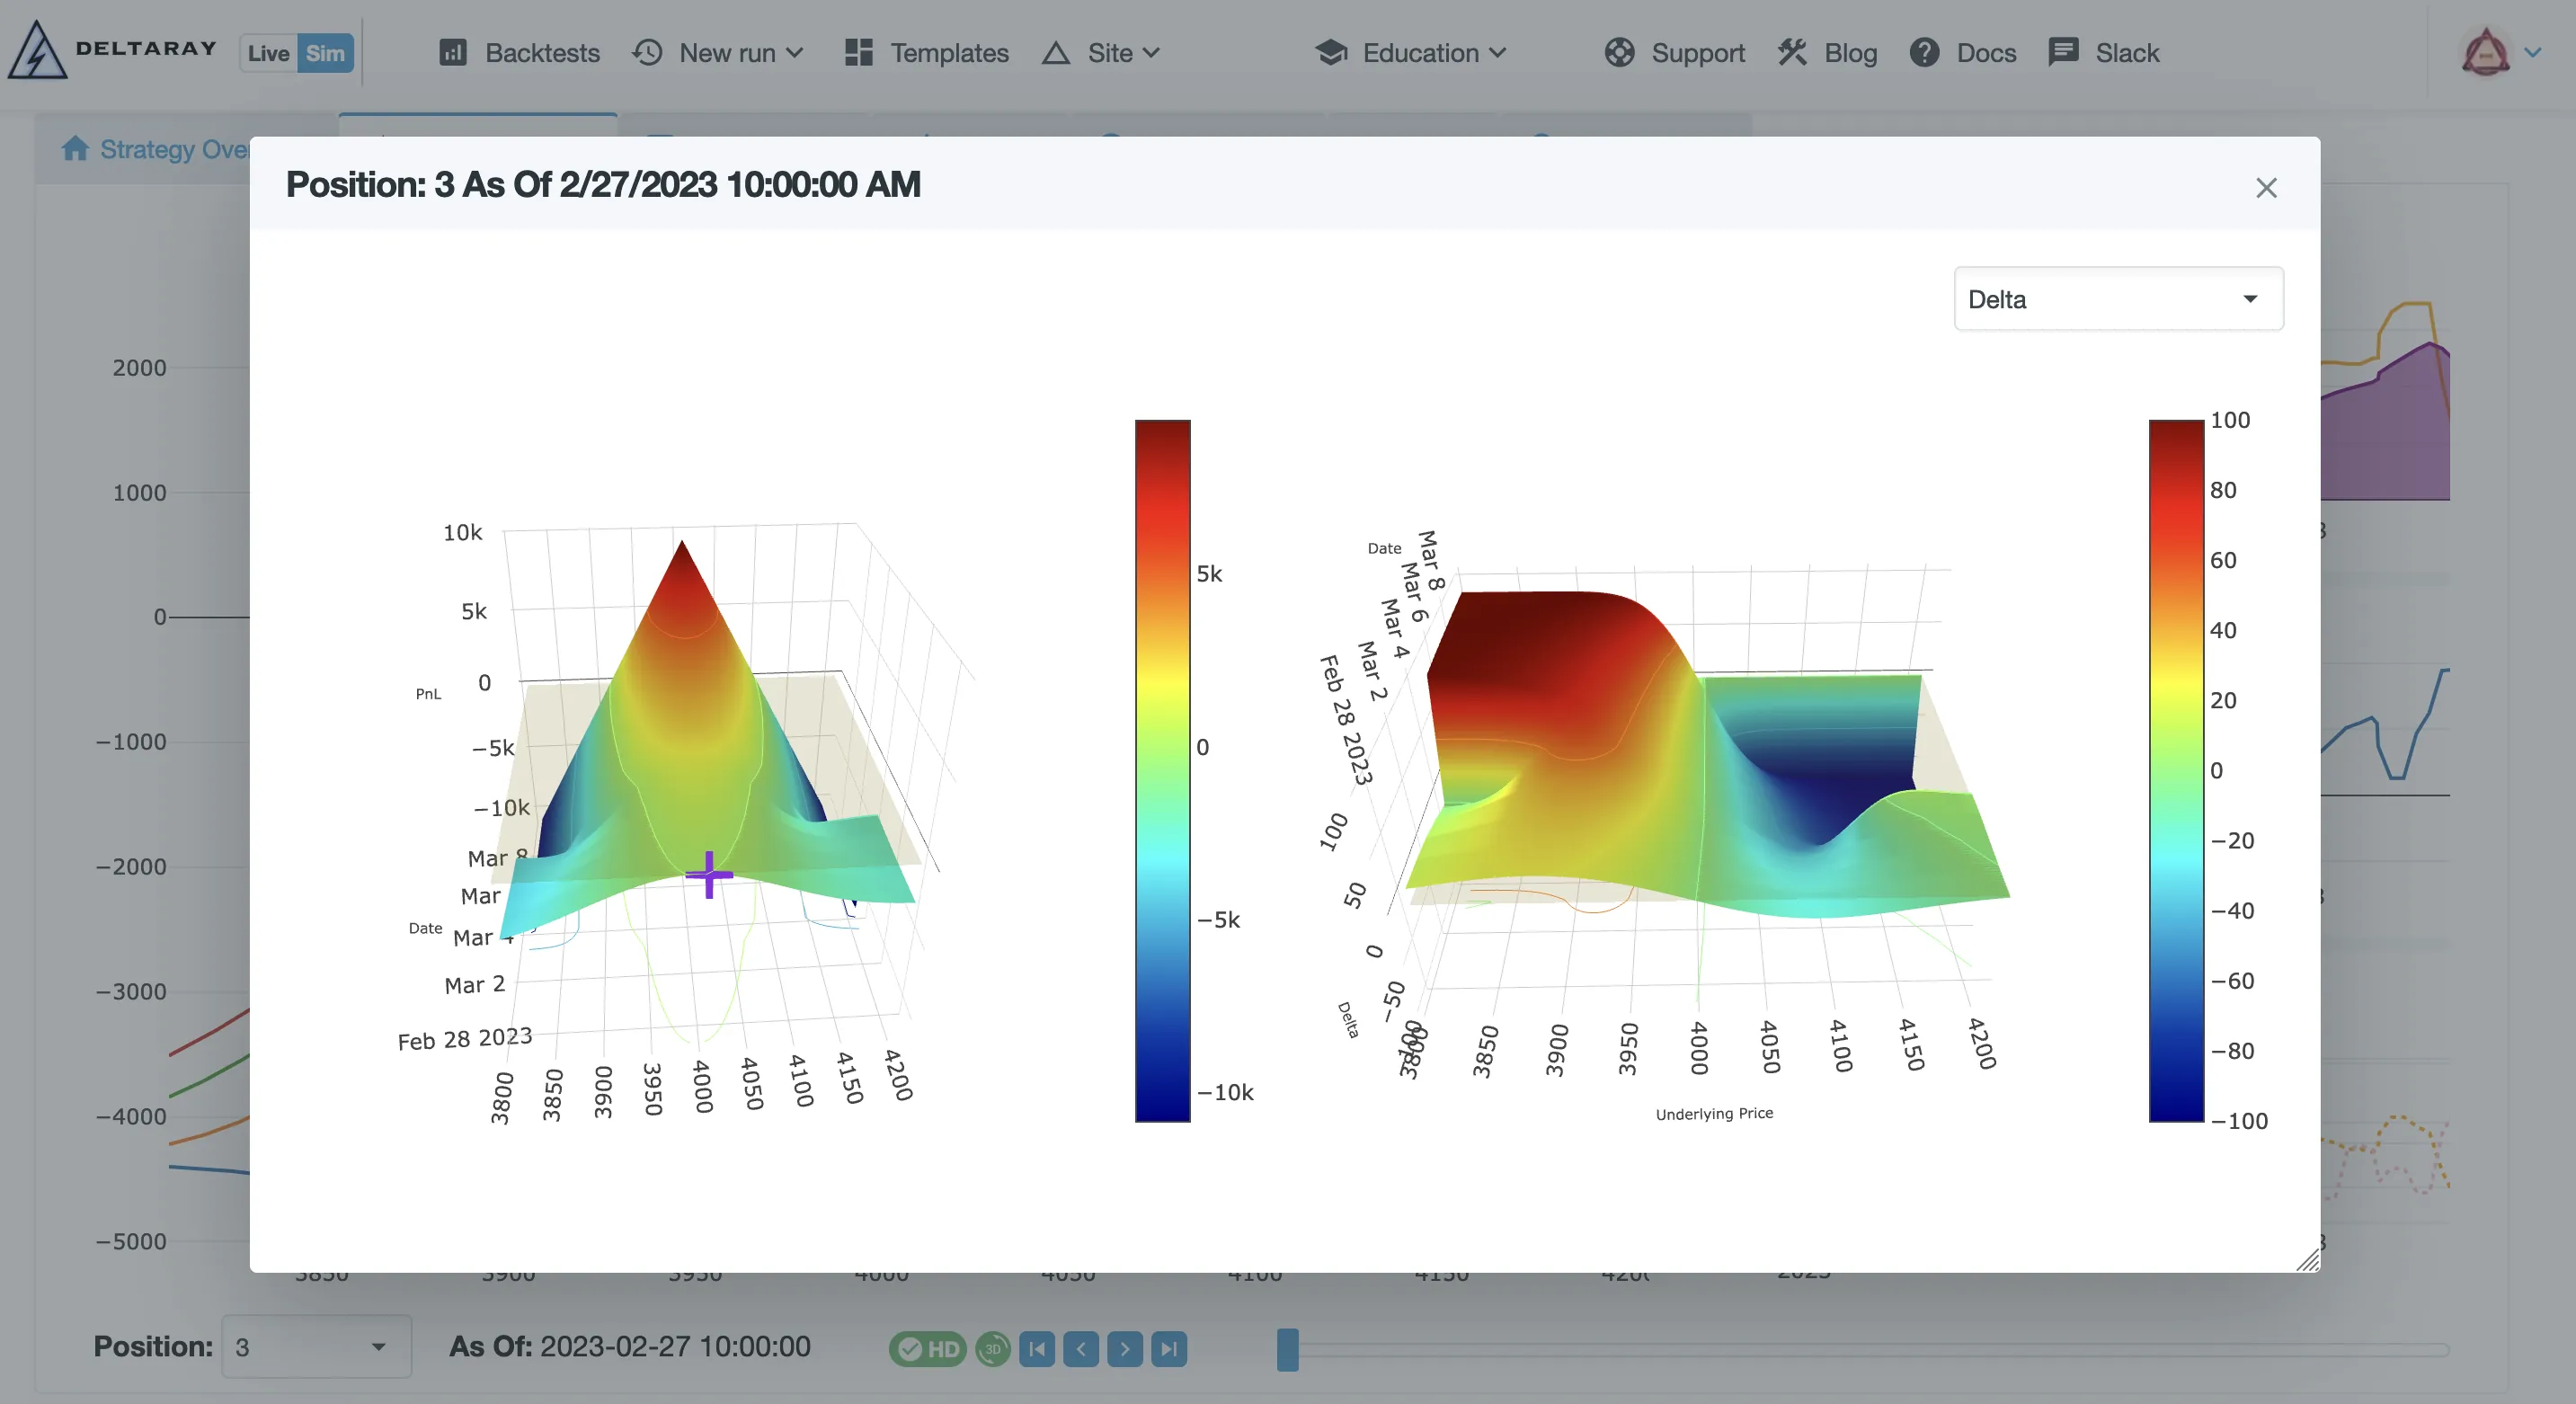
Traditional 2D risk graphs are commonly utilized to illustrate the risk profile of a position. However, due to their format, it is impractical to depict drastic changes (e.g., when a contract expires) in the projection or to demonstrate how the Greeks change over time. To overcome these limitations, we have introduced 3D graphs that display both the PnL projection and the Greeks throughout the entire lifecycle (until the last expiration) of the position.
Usage
To capture the Risk Graphs, you must enable Trace Collection through Settings.Sim.PositionMonitor. Once enabled, the information will be displayed in the Position Monitor tab of a completed backtest.
"Settings": {
  "Sim": {
    "PositionMonitor": {
      "TraceCollectionInterval": "Hourly"
    }
  }
}
The TraceCollectionInterval can be set to:
Off: Trace Collection disabled (fastest)Daily: Sampled at entry and EOD each day (fast)Hourly: Positions are sampled at entry and in every hour thereafter (slowest)
Even with TraceCollection disabled, an approximate Risk Graph is still displayed. Although this Risk Graph isn't as accurate or detailed as those generated with Daily or Hourly settings, it remains useful for validating the structure.
Preferences
The preferred Trace Collection interval can be specified in the Users' Preferences. When set, the specified value will be used in simple and templated runs.