Volatility Surface
Visualize the options implied volatility surface across strikes and time-to-expiry, explore liquidity and risk overlays, and inspect the smile at a target DTE — with single-day or multi‑day playback.
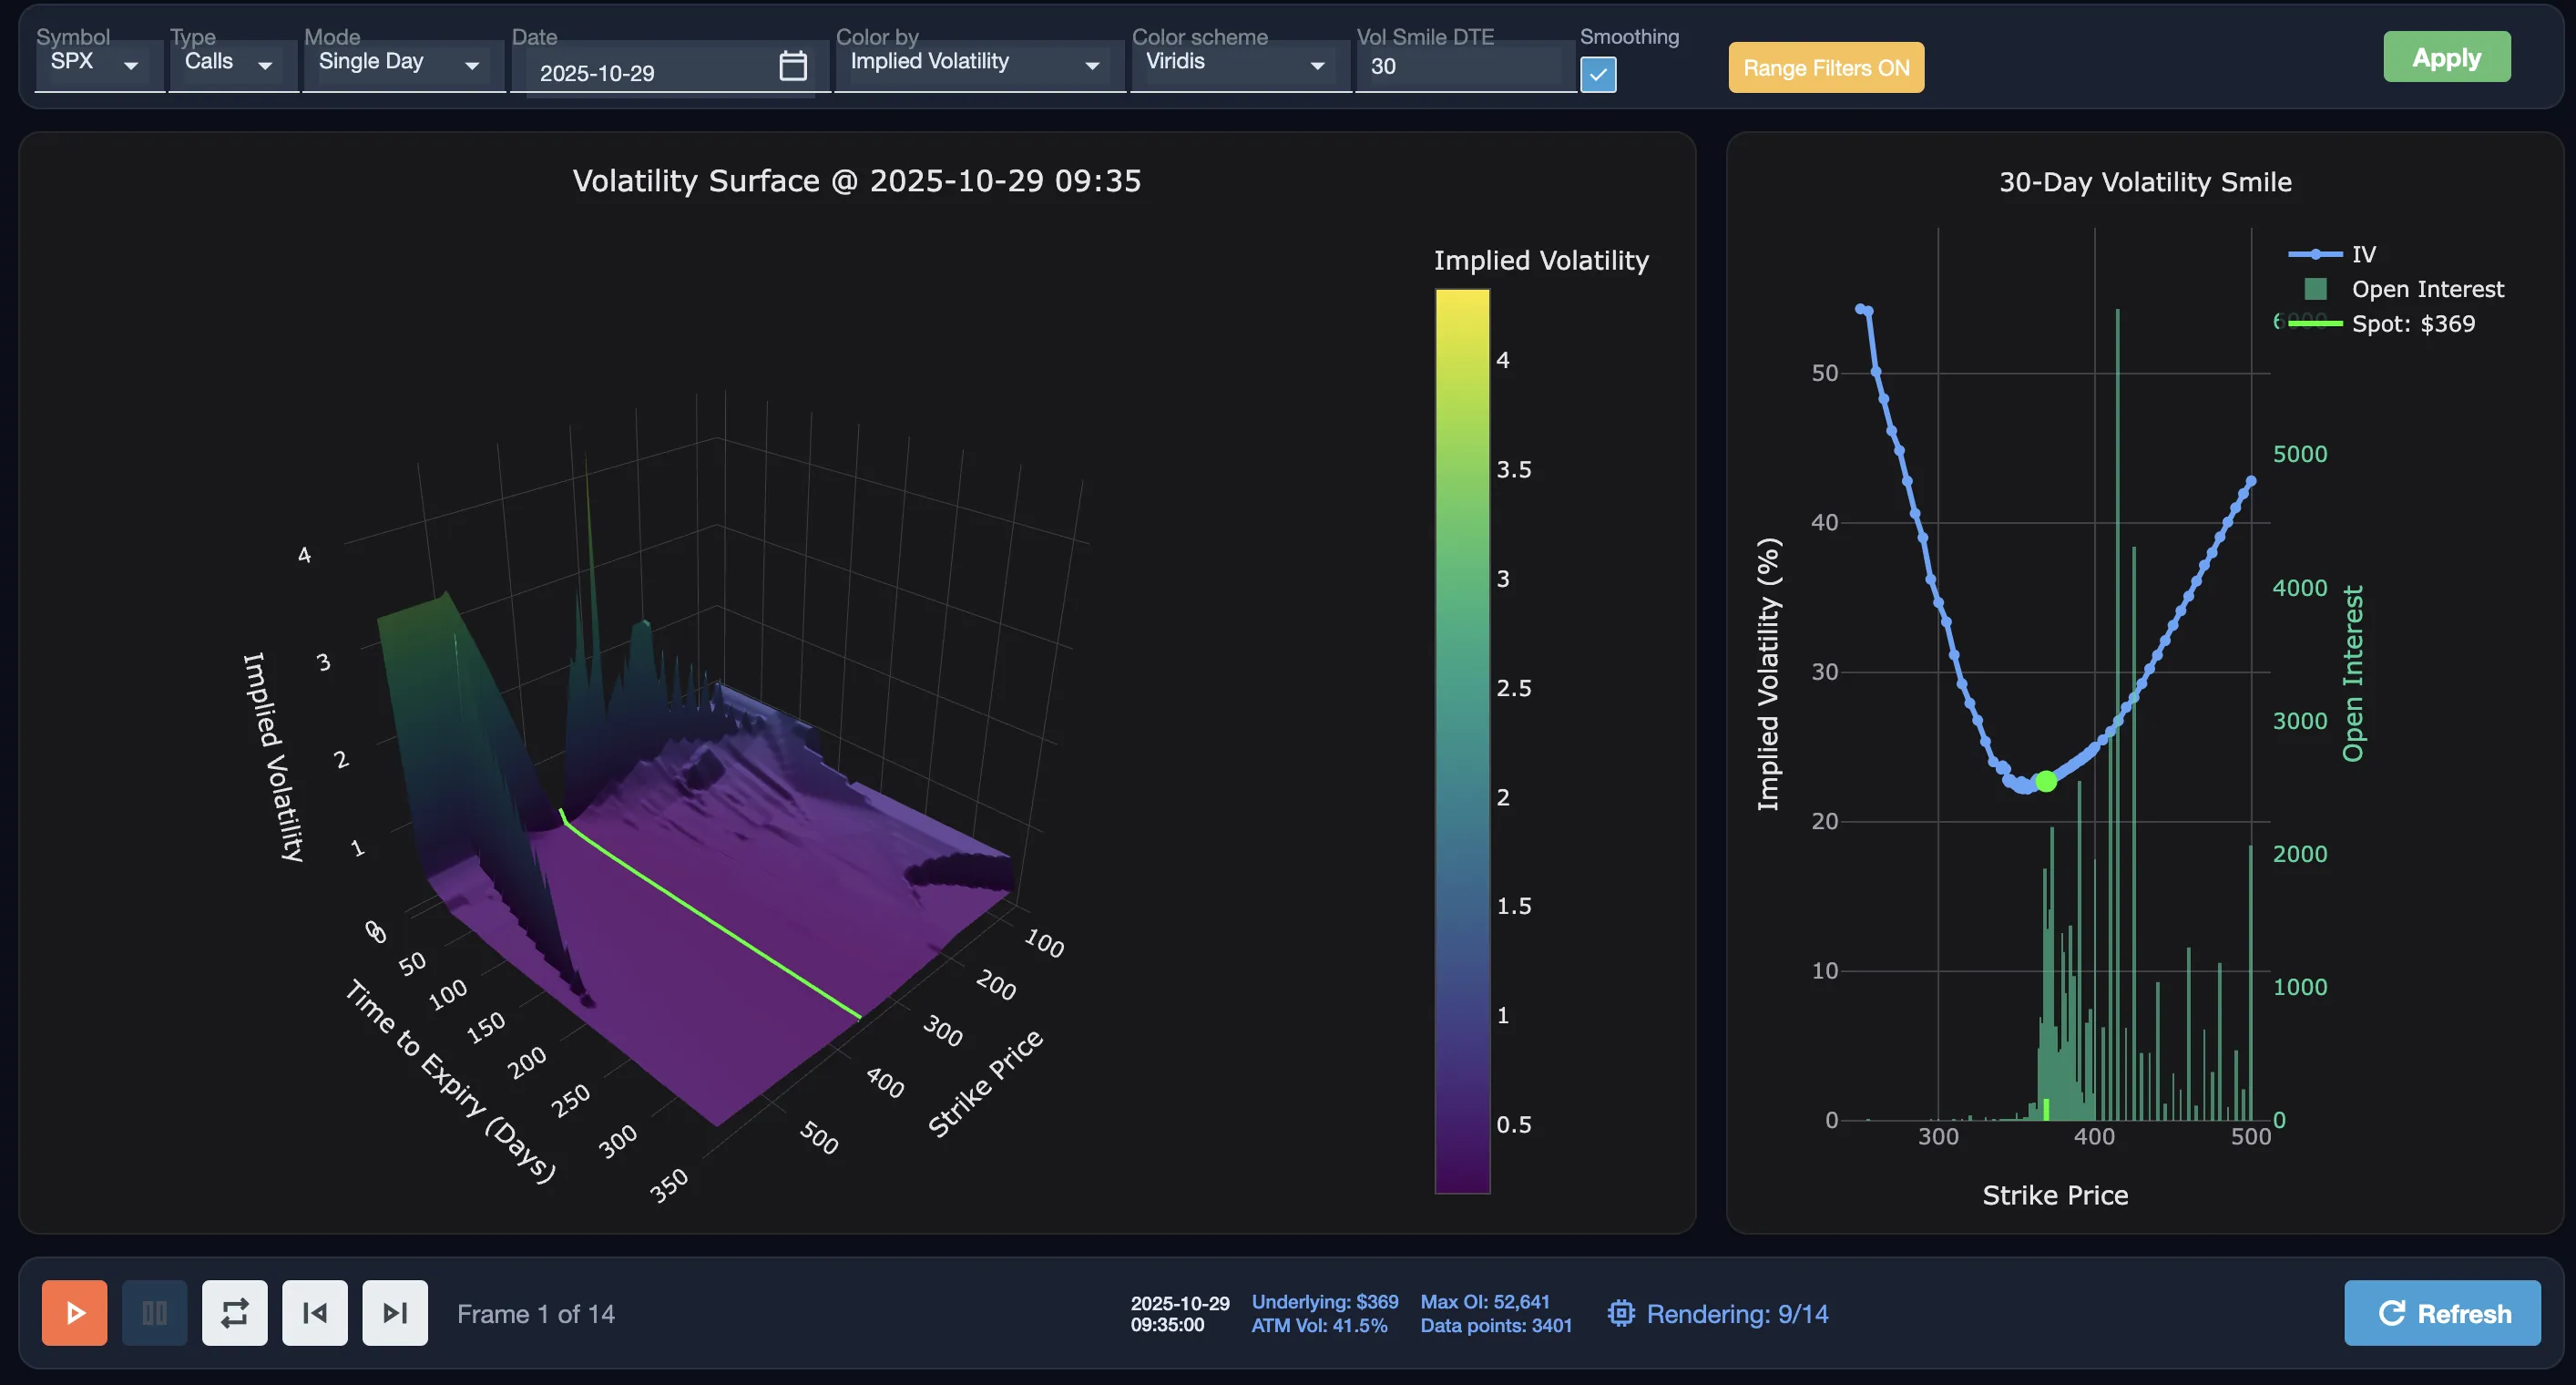
Volatility Surface
Overview
- 3D surface: X = Strike, Y = DTE (days), Z = Implied Volatility; color encodes a selected overlay (e.g., Open Interest).
- Volatility Smile panel: target DTE cross‑section — IV vs Strike (left axis) and Open Interest vs Strike (right axis) with spot line/marker.
- Playback: animate or step through frames (time-of-day across a date range); loop support with fixed axes for visual stability.
Controls
- Symbol: Underlying (non‑crypto in the current version); Option Type: Calls or Puts.
- Mode: Single Day (Date + time‑of‑day) or Multiple Days (Start/End date + one or more time‑of‑day slots at 5‑minute resolution).
- Range Filters: Optional Strike and DTE bounds. Keep at least 2 strikes and 2 expiries for a 3D surface.
- Overlay Metric: Implied Volatility, Gamma Exposure (GEX), Open Interest, Volume, Bid‑Ask Spread, Gamma Exposure, Delta, Gamma, Theta, Vega.
- Color Scheme: Choose a surface color scale (Viridis, Cividis, Greys, etc.).
- Vol Smile DTE: Sets the target DTE for the smile; the nearest expiration is used and the actual DTE is displayed.
- Smoothing: Interpolates data to a regular grid for a continuous surface (helpful when quotes are sparse or irregular).
- Apply: Applies pending changes. Playback: Play/Pause, Loop, Prev/Next frame.
Visualizations
3D Surface
- Axes: Strike (X), DTE in days (Y), Implied Volatility (Z). Color encodes the chosen overlay.
- Hover shows Strike, DTE, IV, and the overlay’s value.
Volatility Smile
- IV vs Strike (left Y‑axis, %) and Open Interest vs Strike (right Y‑axis), with spot line and a spot marker.
- Target DTE picker; panel uses the closest expiration and shows the actual DTE.
Tips & Interpretation
- Skew/smile: Inspect how IV varies with moneyness at a target DTE; watch changes intraday with playback.
- Term structure: Observe IV across different maturities (Y‑axis); compare frames to see how the surface shifts through time.
- Liquidity: Use Open Interest, Volume, and Bid‑Ask Spread overlays to find liquid/illiquid areas.
- Risk cues: Gamma Exposure hotspots and per‑contract Greeks (Δ/Γ/Θ/ν) overlays help identify sensitivity pockets.